如何在.NET 8.0中使用MiniProfiler
Science is gold.
引言
作为一个开发人员,你知道如何分析自己开发的Api性能么?
本文我将引入另外一个工具MiniProfiler, 我将讲解如何将MiniProfiler集成到.NET 8.0 WebAPI中。
MiniProfiler也是一款免费的工具(官网地址:https://miniprofiler.com/dotnet/) 你可以用它精确的分析ASP .NET 和ASP .NET Core应用程序的任何代码。
tips: MiniProfiler 在ASP.NET和控制台应用中也可以使用~
安装
Install-Package MiniProfiler.AspNetCore.Mvc
Install-Package MiniProfiler.EntityFrameworkCore
MiniProfiler.EntityFrameworkCore 用来监控EF Core生成的SQL
配置
ConfigureServices添加服务
// ConfigureServices...
services.AddMiniProfiler(options =>
{
    // All of this is optional. You can simply call .AddMiniProfiler() for all defaults

    // (Optional) Path to use for profiler URLs, default is /mini-profiler-resources
    options.RouteBasePath = "/profiler";

    // (Optional) Control storage
    // (default is 30 minutes in MemoryCacheStorage)
    // Note: MiniProfiler will not work if a SizeLimit is set on MemoryCache!
    //   See: https://github.com/MiniProfiler/dotnet/issues/501 for details
    (options.Storage as MemoryCacheStorage).CacheDuration = TimeSpan.FromMinutes(60);

    // (Optional) Control which SQL formatter to use, InlineFormatter is the default
    options.SqlFormatter = new StackExchange.Profiling.SqlFormatters.InlineFormatter();

    // 设定弹出窗口的位置是左下角
    options.PopupRenderPosition = RenderPosition.Left;

    // 设定在弹出的明细窗口里会显式Time With Children这列
    options.PopupShowTimeWithChildren = true;

    // // (Optional) To control authorization, you can use the Func<HttpRequest, bool> options:
    // // (default is everyone can access profilers)
    // options.ResultsAuthorize = request => MyGetUserFunction(request).CanSeeMiniProfiler;
    // options.ResultsListAuthorize = request => MyGetUserFunction(request).CanSeeMiniProfiler;
    // // Or, there are async versions available:
    // options.ResultsAuthorizeAsync = async request => (await MyGetUserFunctionAsync(request)).CanSeeMiniProfiler;
    // options.ResultsListAuthorizeAsync = async request => (await MyGetUserFunctionAsync(request)).CanSeeMiniProfilerLists;
    //
    // // (Optional)  To control which requests are profiled, use the Func<HttpRequest, bool> option:
    // // (default is everything should be profiled)
    // options.ShouldProfile = request => MyShouldThisBeProfiledFunction(request);
    //
    // // (Optional) Profiles are stored under a user ID, function to get it:
    // // (default is null, since above methods don't use it by default)
    // options.UserIdProvider = request => MyGetUserIdFunction(request);
    //
    // // (Optional) Swap out the entire profiler provider, if you want
    // // (default handles async and works fine for almost all applications)
    // options.ProfilerProvider = new MyProfilerProvider();

    // (Optional) You can disable "Connection Open()", "Connection Close()" (and async variant) tracking.
    // (defaults to true, and connection opening/closing is tracked)
    options.TrackConnectionOpenClose = true;

    // (Optional) Use something other than the "light" color scheme.
    // (defaults to "light")
    options.ColorScheme = StackExchange.Profiling.ColorScheme.Light;

    // Optionally change the number of decimal places shown for millisecond timings.
    // (defaults to 2)
    options.PopupDecimalPlaces = 1;

    // The below are newer options, available in .NET Core 3.0 and above:

    // (Optional) You can disable MVC filter profiling
    // (defaults to true, and filters are profiled)
    options.EnableMvcFilterProfiling = true;
    // ...or only save filters that take over a certain millisecond duration (including their children)
    // (defaults to null, and all filters are profiled)
    // options.MvcFilterMinimumSaveMs = 1.0m;

    // (Optional) You can disable MVC view profiling
    // (defaults to true, and views are profiled)
    options.EnableMvcViewProfiling = true;
    // ...or only save views that take over a certain millisecond duration (including their children)
    // (defaults to null, and all views are profiled)
    // options.MvcViewMinimumSaveMs = 1.0m;

    // (Optional) listen to any errors that occur within MiniProfiler itself
    // options.OnInternalError = e => MyExceptionLogger(e);

    // (Optional - not recommended) You can enable a heavy debug mode with stacks and tooltips when using memory storage
    // It has a lot of overhead vs. normal profiling and should only be used with that in mind
    // (defaults to false, debug/heavy mode is off)
    //options.EnableDebugMode = true;


}).AddEntityFramework();
激活中间件,启用MiniProfiler服务
// ...
app.UseMiniProfiler(); // The call to app.UseMiniProfiler must come before the call to app.UseMvc、app.UseEndpoints、app.MapControllers
// ...
app.MapControllers(); // app.UseMvc(); app.UseEndpoints
在 _ViewImports.cshtml页面中增加如下两行命令。
@using StackExchange.Profiling
@addTagHelper *, MiniProfiler.AspNetCore.Mvc
_Layout.cshtml:
<!DOCTYPE html>

<html>
<head>
    <meta name="viewport" content="width=device-width" />
    <title>@ViewBag.Title</title>
</head>
<body>
    <div>
        @RenderBody()
    </div>
<mini-profiler />
</body>
</html>
配置需要监控分析的代码(可选)
public class ValueController : ControllerBase
{
   [HttpGet]
   public IEnumerable<string> Get()
   {
      string url1 = string.Empty;
      string url2 = string.Empty;
      using (MiniProfiler.Current.Step("Get方法"))
      {
         using (MiniProfiler.Current.Step("准备数据"))
         {
            using (MiniProfiler.Current.CustomTiming("SQL", "SELECT * FROM Config"))
            {
               // 模拟一个SQL查询
               Thread.Sleep(500);

               url1 = "https://www.baidu.com";
                url2 = "https://www.sina.com.cn/";
            }
         }


         using (MiniProfiler.Current.Step("使用从数据库中查询的数据,进行Http请求"))
         {
            using (MiniProfiler.Current.CustomTiming("HTTP", "GET " + url1))
            {
               var client = new WebClient();
               var reply = client.DownloadString(url1);
            }

            using (MiniProfiler.Current.CustomTiming("HTTP", "GET " + url2))
            {
               var client = new WebClient();
               var reply = client.DownloadString(url2);
            }
         }
      }
      return new string[] { "value1", "value2" };
   }
}
代码解释:
MiniProfiler.Current.Step方法定义了分析的步骤,这个方法可以接受一个String类型的参数,它会显示在最终的报告中MiniProfiler.Current.CustomTiming方法是更细粒度的对报告内容进行分类,以上代码中定义了2种分类,一种是SQL, 一种是Http上述程序的功能: 模拟从数据库拉取2个网站的Url, 并使用
WebClient来分别请求网站的Url
效果
下面我们启动项目, 项目默认打开/api/values

然后我们来访问以下/profiler/results, 就会出现如下页面
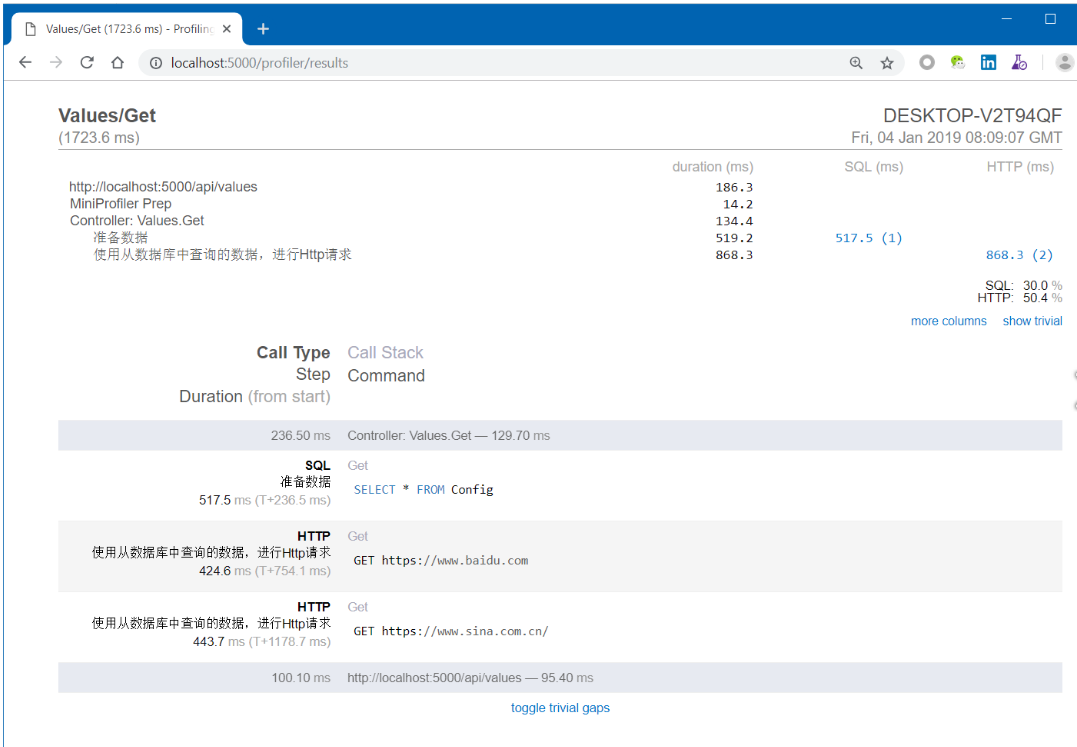
如上图所示,我们可以很清楚的看到代码中每一部分的耗时,由于我们添加了2种分类SQL和Http,所以列表中会对2种分类进行汇总。
从当前报告中可以得到以下结论
当前请求总响应时间 1723.6ms
2次Http请求共耗时868.3ms, 其中访问百度耗时424.6ms, 访问新浪耗时443.7ms
结果页面路径相关说明
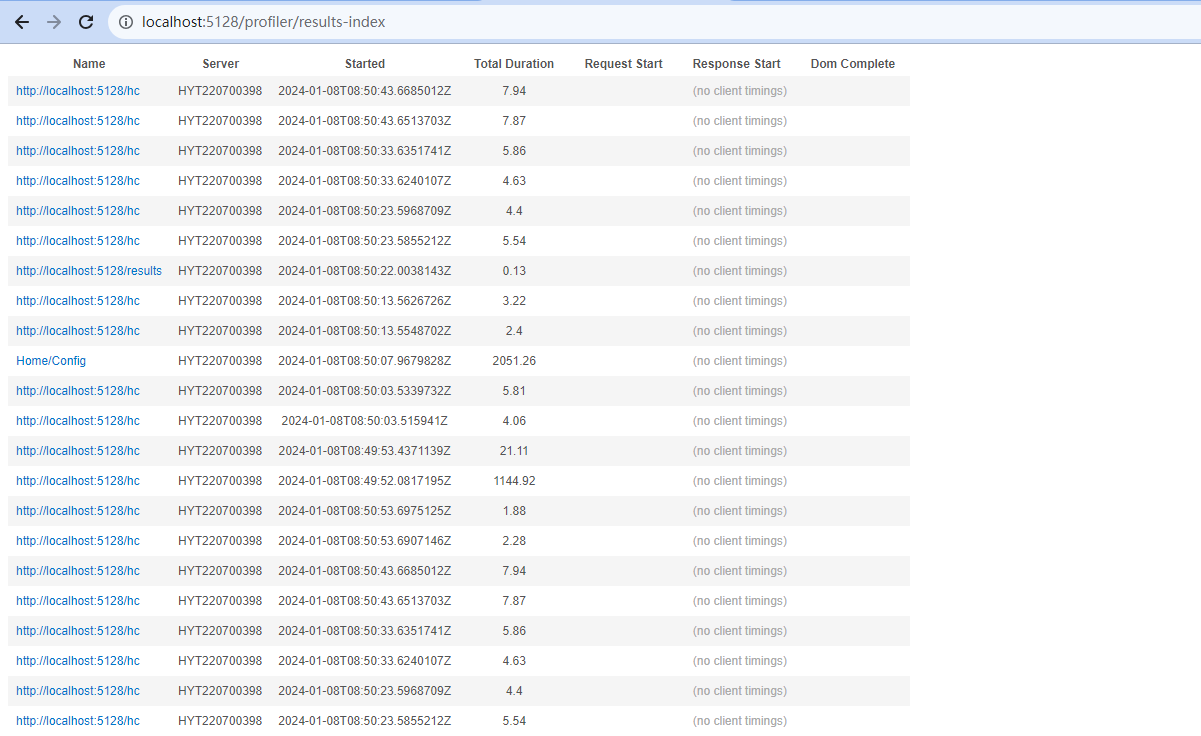
MiniProfiler的监控列表地址:http://{xxx}/profiler/results-index
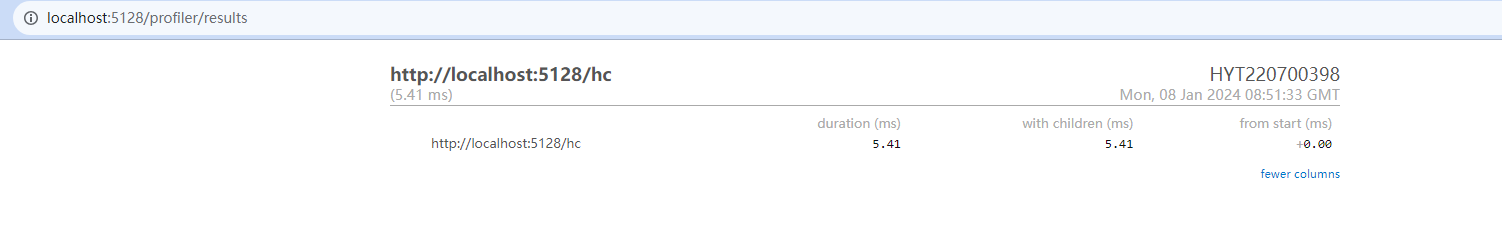
最新一次监控数据:http://{xxx}/profiler/results
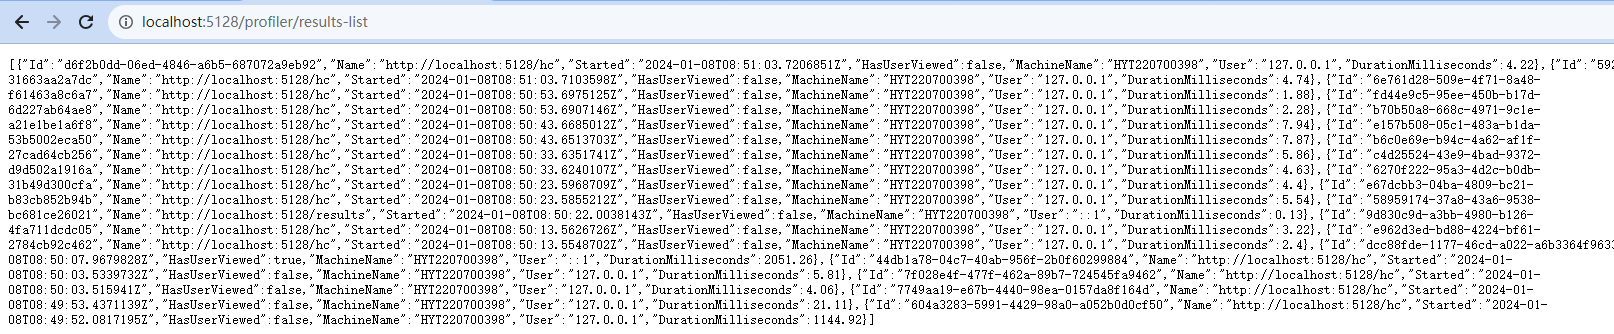
监控列表meta-data数据:http://{xxx}/profiler/results-list
MiniProfiler与Swagger集成
这里我们就不再讲如何在ASP.NET Core中整合Swagger。
MiniProfiler和Swagger是可以集成在一起的,为了完成这个功能,我们需要进行以下几步:
下载Swagger自定义页面
默认的index.html页面可以从下面的链接下载:
将该文件放到API层的根目录下,设置文件属性为【嵌入的资源】

index.html文件加入scripts脚本
我们首先需要获取用于显示MiniProfiler的html代码片段,随便写个控制器,使用MiniProfiler的API输出一下就可以了。
 [HttpGet]
 public IActionResult GetScripts() {
     var html = MiniProfiler.Current.RenderIncludes(_accessor.HttpContext);
      return Ok(html.Value);
  }
注:_accessor是通过依赖注入IHttpContextAccessor接口获取的。IHttpContextAccessor需要在Startup.cs中进行注册。
// ConfigureService...
builder.Services.AddHttpContextAccessor();

// controler:
 private readonly IHttpContextAccessor _accessor;

 public HomeController(IHttpContextAccessor accessor)
 {
     _accessor = accessor;
 }
然后我们将生成的内容拷贝出来粘贴在Swagger的index.html顶部:
 <script async="async" id="mini-profiler" src="/profiler/includes.min.js?v=4.3.8+1120572909"
         data-version="4.3.8+1120572909"
         data-path="/profiler/"
         data-current-id="f4220fb4-d3c6-4355-b1be-13d47b10dc4c"
         data-ids="f4220fb4-d3c6-4355-b1be-13d47b10dc4c"
         data-position="Left"
         data-scheme="Light"
         data-authorized="true"
         data-children="true"
         data-max-traces="15"
         data-toggle-shortcut="Alt+P"
         data-trivial-milliseconds="2.0"
         data-ignored-duplicate-execute-types="Open,OpenAsync,Close,CloseAsync">
 </script>
注意:不要在网上随便找个MiniProfiler的HTML代码片段就拷贝到index.html中使用,这样是不会成功的,因为拷贝来的的版本号和我们所引用Nuget的版本号并不一致。
安装自定义页面
我们需要修改UseSwaggerUI中间件的配置,这里我们需要添加一个InputStream配置:
app.UseSwaggerUI(options =>
{
    // MiniProfiler与Swagger 集成
    options.IndexStream = () => typeof(Program).GetTypeInfo().Assembly
        .GetManifestResourceStream("MiniProfilerSample.index.html");
});
注意:这里
MiniProfilerSample是项目的命名空间名
最终效果
重新启动项目,Swagger文档页面的左上角就出现了一个小的面板,当模拟请求一个连接之后,它就会显示出当前请求的分析数据,看起来是不是很酷炫。

总结
本篇博客描述了如何使用MiniProfiler来监控分析你的Api。 MiniProfiler除了提供网页显示报告,还支持将报告结果存储在数据库中,后面我会补充一篇文章来说明如何将报告保存到数据库中。